
VitIndex is live: Dutch municipalities can base sport and physical activity policy on data down to neighbourhood level. Researchable built the dashboard.
In brief
- VitIndex launched nationally on 23 September 2026 and is free to use for Dutch municipalities and professionals working on sport, physical activity, health and broad prosperity, via vitindex.nl.
- The dashboard brings together public data that used to be scattered across separate sources, and shows it at regional, municipal and neighbourhood level, with the option to compare areas.
- VitIndex was developed by the Mulier Institute and the Association of Sports and Municipalities (VSG) and tested in a pilot with 17 municipalities, from large to small and from urban to rural.
- Researchable built the platform as the technical partner of Sport Data Valley: the web application, the interactive map and the data integrations. We also handle its maintenance, security and hosting.

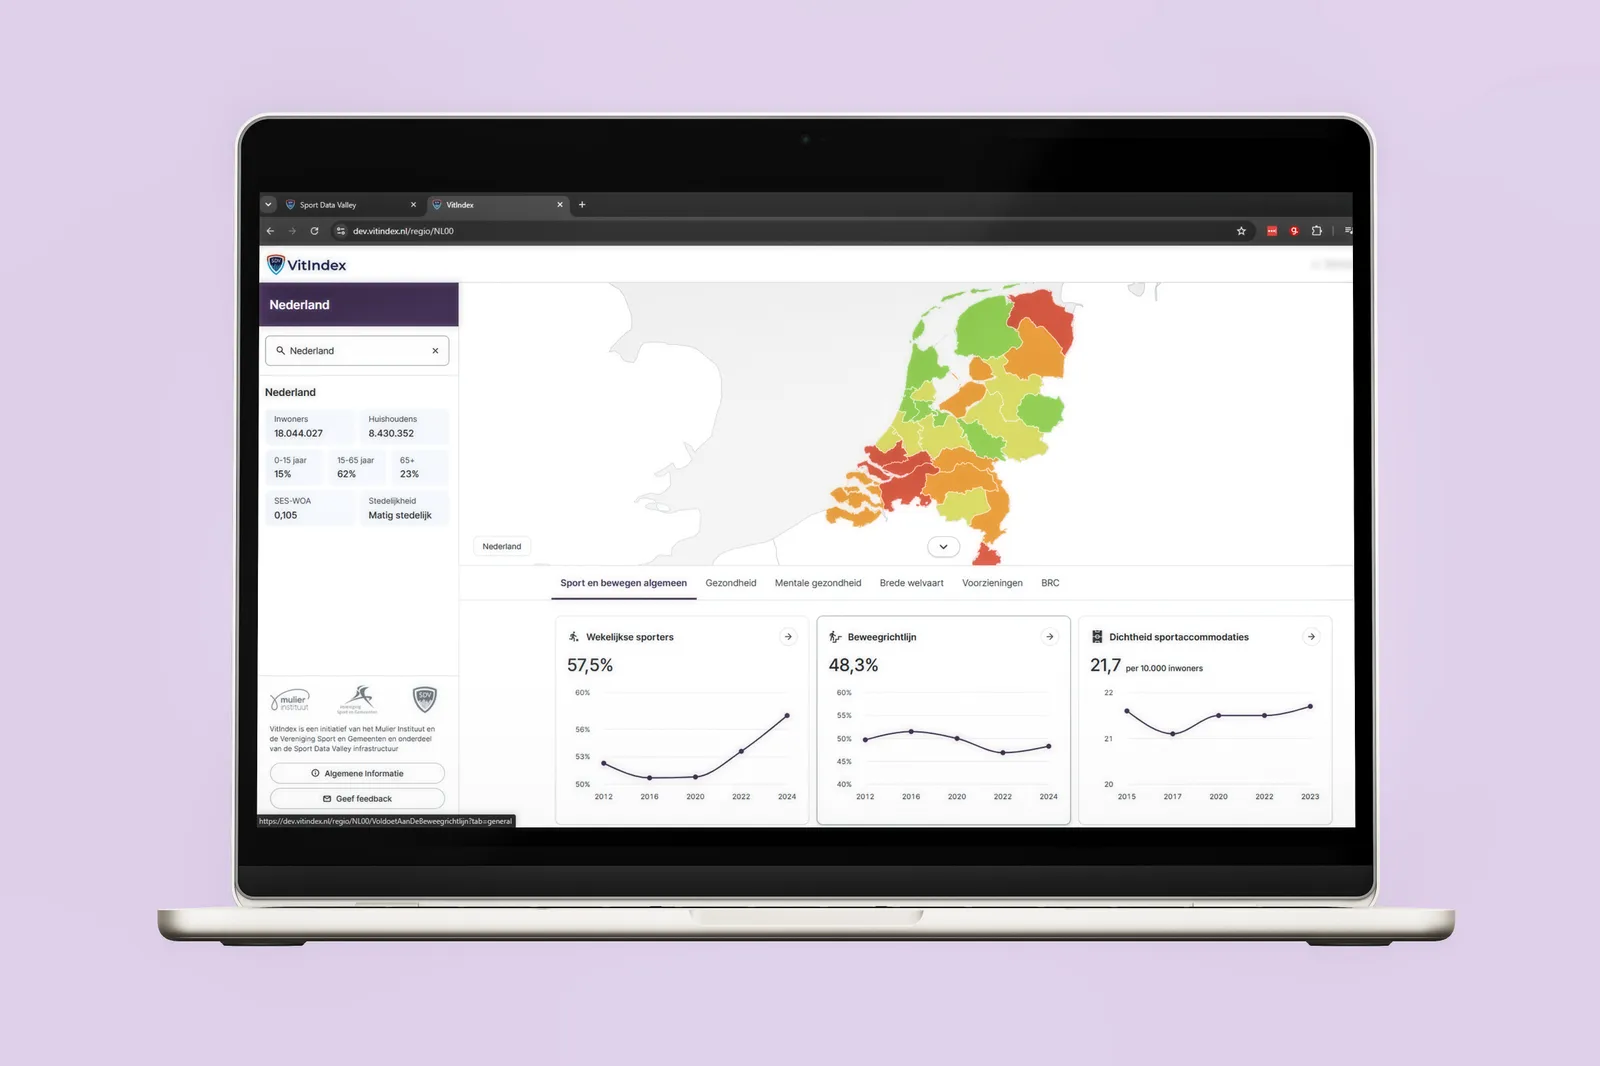
From today, Dutch municipalities can use VitIndex: an online dashboard that brings data on sport, physical activity, health and broad prosperity together in one place, as a foundation for better-informed sport and physical activity policy. In a few clicks, a policy officer can see how their municipality is doing on sports participation, overweight or how activity-friendly the environment is, down to neighbourhood level, and how that compares with other municipalities or the national average.
VitIndex was developed by the Mulier Institute and the Association of Sports and Municipalities (VSG) and was presented today at the VSG Congress in Zoetermeer. The platform runs within the infrastructure of Sport Data Valley. Researchable built it as the technical partner of Sport Data Valley and remains responsible for its maintenance.
What does VitIndex show?
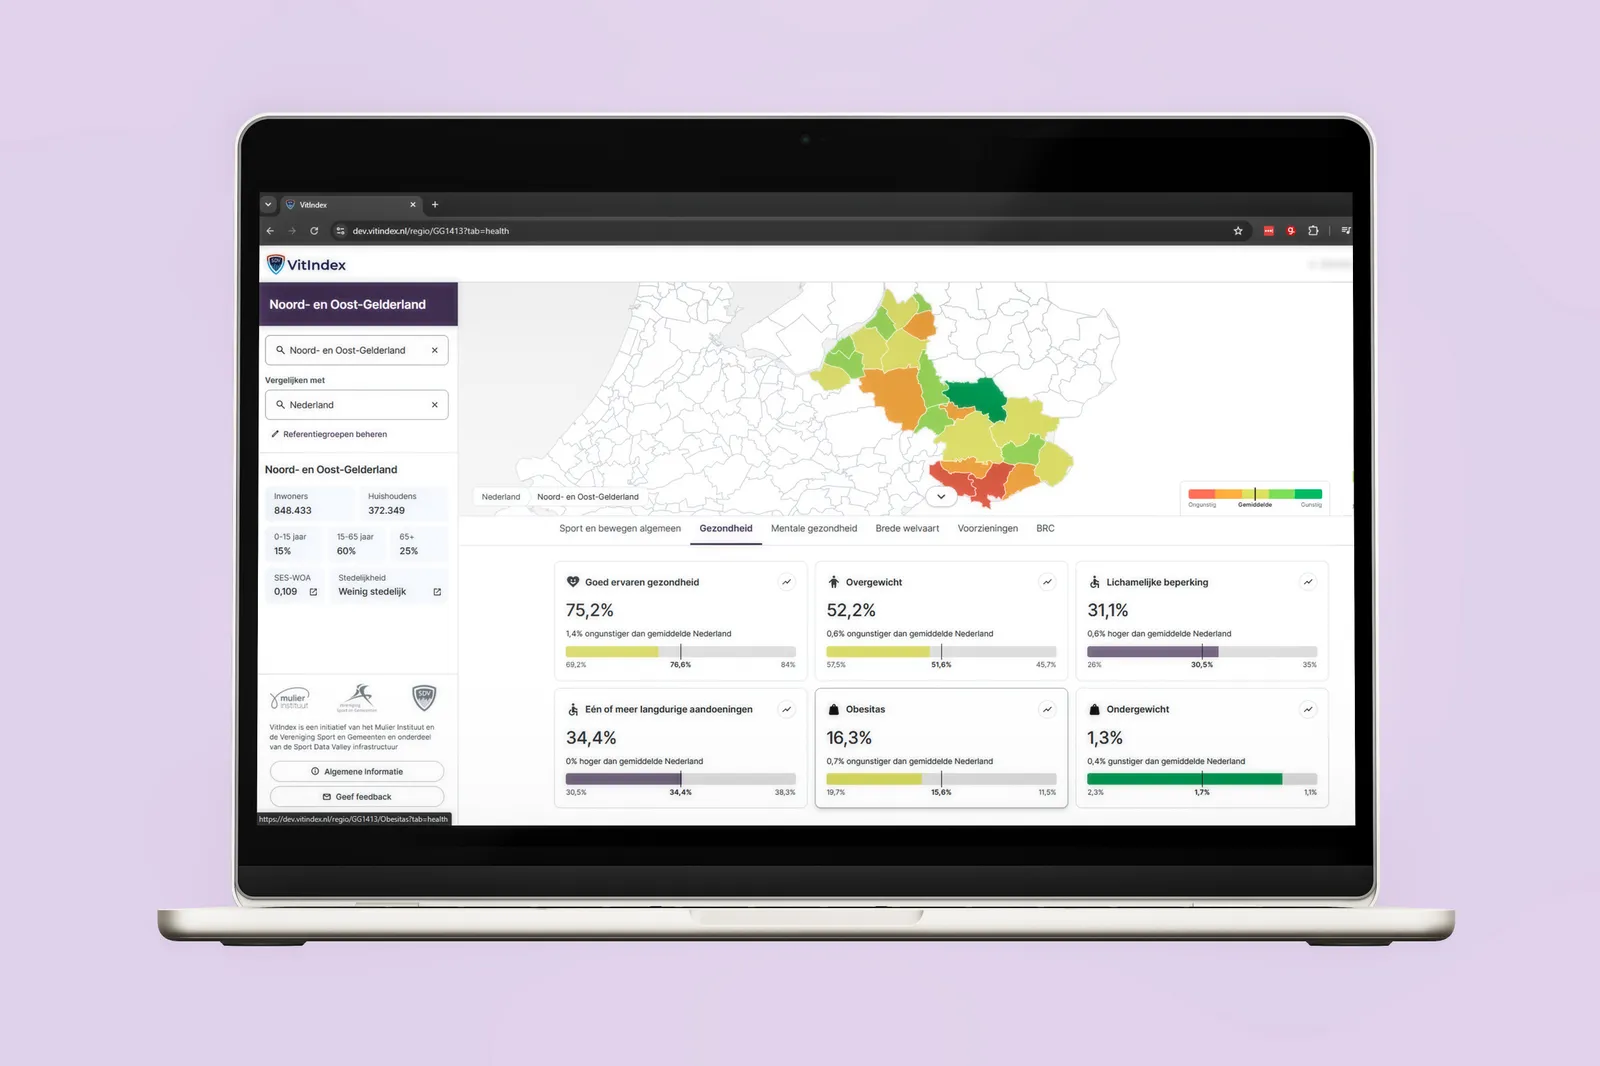
VitIndex is a free policy dashboard for municipalities. For each area, it shows indicators such as sports participation, the number of sports facilities, overweight and perceived quality of life. The data is grouped into themes: sport and physical activity in general, health, mental health, broad prosperity and facilities.
Much of that data was already public, but it was spread across different sources. According to Dennis van Kooij, Sport Data Valley expert at the Mulier Institute, bringing it together is exactly where the strength of VitIndex lies: municipalities get up-to-date information in one environment and can easily view and compare it at neighbourhood, municipal and regional level.
VitIndex replaces two existing tools: VSG's Monitor Sport en Gemeenten and the Mulier Institute's regional perspectives (regioperspectieven).
From data to better sport and physical activity policy in the neighbourhood
The dashboard does not only show figures on sport and physical activity, but also how they relate to health and broad prosperity. Mirjam Wallien, policy adviser at VSG, stresses that the point is not to collect even more data, but to make better use of the information that already exists. By connecting these themes, municipalities get a sharper view of where the opportunities and challenges are.
An example: if sports participation lags behind in a particular neighbourhood, that can be a reason to work with local partners to see what support or facilities are needed. Think of deploying neighbourhood sports coaches, where sports facilities are located, or a neighbourhood-based approach.
A separate tile on swimming pools gives insight into their current situation and future, as input for discussions about sustainability and investment. That tile will be developed further in the coming period, with the aim of a final version for national roll-out at the end of 2026.
Tested by 17 municipalities
Before the launch, VitIndex was tested in a pilot with 17 municipalities, deliberately chosen to be diverse: from large to small, from urban to rural. Their experiences were used to develop the dashboard further.
Simon Hoekman, broad prosperity policy adviser at the municipality of Dronten, was one of the participants. He describes looking up sport and physical activity data as easy, and it was above all the availability of information at neighbourhood level that got his team enthusiastic. The main request from the pilot: more ways to compare neighbourhoods, municipalities and regions. Those are now in the dashboard, including custom reference groups.
The role of Researchable
Researchable is the technical builder of VitIndex. Commissioned by the Mulier Institute and Sport Data Valley, for whom we previously built the national sports data platform, we turned a wide range of scientific datasets into a scalable web application that a policy officer without a data background can use. The Mulier Institute provides the content and the indicators; as product owner, Dennis van Kooij translated the wishes of municipalities into work for our development team.
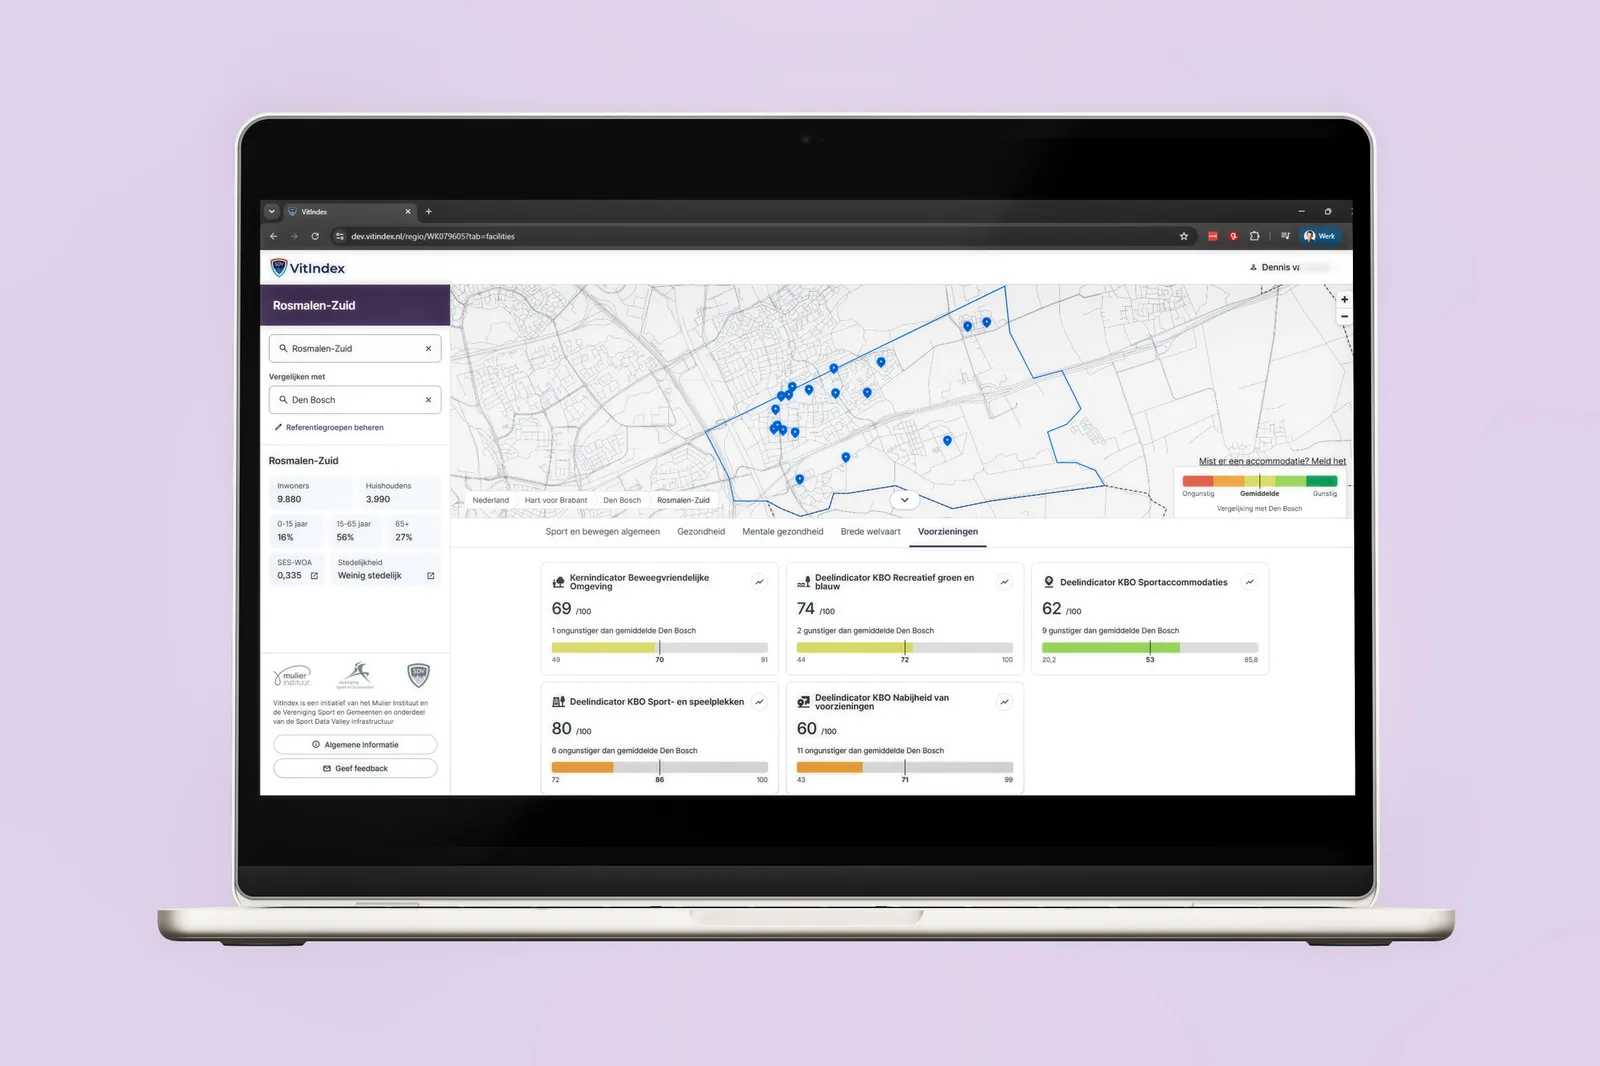
- Interactive map: a map of the Netherlands based on GeoJSON, drilling down from country and region to municipality and neighbourhood. Hover over a chart and the matching area lights up on the map.
- Dashboards with core indicators: trends and comparisons per theme, including the Core Indicators for an Activity-Friendly Environment (KBO), set against a comparison area of your choice.
- Context panel: the key facts for every area at a glance, such as population, age structure, socio-economic status and degree of urbanisation, because physical activity is closely linked to the make-up of a neighbourhood.
- Maintenance and hosting: VitIndex runs on the Sport Data Valley server cluster and falls under the same service agreements, with monitoring, security updates and availability commitments.
The biggest challenge was not the technology, but translating raw data into strategic relevance. Unlocking everything just because you can leads to noise, not results.
Wietse de Vries, machine learning engineer at Researchable
That principle guided the design choices: not every available indicator on screen, but the figures a municipality needs to answer a policy question, with enough context to read them correctly. How we set up platforms like this, from data sources to dashboard, is described under data architecture and engineering.
Available from today
VitIndex is free to use for municipalities and professionals working on sport, physical activity, health and broad prosperity. You can create an account at vitindex.nl.
Organisations involved in the development include the Beweegalliantie, NOC*NSF, JOGG and the Kenniscentrum Sport & Bewegen. VitIndex also works with RIVM, the Dutch National Institute for Public Health and the Environment, the Platform Ondernemende Sportaanbieders (POS) and InnoBeweegLab.

Frequently asked questions
What is VitIndex?
VitIndex is a free online dashboard for Dutch municipalities that brings together data on sport, physical activity, health and broad prosperity. Users view the figures at regional, municipal and neighbourhood level and compare areas with each other or with the national average.
Who developed VitIndex?
VitIndex was developed by the Mulier Institute and the Association of Sports and Municipalities (VSG) and runs within the Sport Data Valley infrastructure. Researchable built the software as the technical partner of Sport Data Valley and handles its maintenance, security and hosting.
What data does VitIndex contain?
Among other things: sports participation, the number of sports facilities, overweight, perceived quality of life and the Core Indicators for an Activity-Friendly Environment. The data is grouped into themes: sport and physical activity in general, health, mental health, broad prosperity and facilities. A tile on swimming pools is being developed further until the end of 2026.
How do you get access to VitIndex?
VitIndex has been freely available since 23 September 2026. Municipalities and professionals can create an account at vitindex.nl.
Which tools does VitIndex replace?
VitIndex replaces VSG's Monitor Sport en Gemeenten and the Mulier Institute's regional perspectives.